Low-level analysis of Linux block devices
Photo by Vincent Botta on Unsplash
Good afternoon, colleagues!
In this article I would like to tell and show how to conduct a low-level analysis of the performance and operation of block devices in Linux.
To work on, you need a utility blktrace, installation on CentOS 7 looks like this:
[root@centos7 ~]# yum install -y blktrace
The first thing we need to do is start dump recording of all events sent to the device.
[root@centos7 blktrace]# blktrace -d /dev/sda -o sda
In this command, we specify our device through the ** - d ** key, and through the ** - o ** key the file that will contain our dump.
The dump file is binary, and to display the content in human readable form, run the blkparse utility (which is included in the blktrace package).
[root@centos7 blktrace]# blkparse -i sda.blktrace.0
Input file sda.blktrace.0 added
8,2 0 1 0.000000000 1322 A FWS 0 + 0 <- (253,0) 0
8,0 0 2 0.000001836 1322 Q FWS [kworker/0:3]
8,0 0 3 0.000007583 1322 G FWS [kworker/0:3]
8,0 0 4 0.000008596 1322 P N [kworker/0:3]
8,0 0 5 0.000011182 1322 I FWS [kworker/0:3]
8,0 0 6 0.000013240 1322 U N [kworker/0:3] 1
8,2 0 7 0.000260525 393 A WM 1682144 + 32 <- (253,0) 736
8,0 0 8 0.000261325 393 A WM 3781344 + 32 <- (8,2) 1682144
8,0 0 9 0.000262451 393 Q WM 3781344 + 32 [xfsaild/dm-0]
…
CPU0 (sda):
Reads Queued: 8, 620KiB Writes Queued: 37, 689KiB
Read Dispatches: 8, 620KiB Write Dispatches: 29, 689KiB
Reads Requeued: 0 Writes Requeued: 0
Reads Completed: 8, 620KiB Writes Completed: 41, 689KiB
Read Merges: 0, 0KiB Write Merges: 2, 20KiB
Read depth: 1 Write depth: 8
IO unplugs: 18 Timer unplugs: 0
Throughput (R/W): 6KiB/s / 7KiB/s
Events (sda): 339 entries
Skips: 0 forward (0–0.0%)
- Output consists of 2 parts:
events (like tcpdump)
statistics broken down by CPU cores
Events
Standard statistics output consists of the following fields
%D %2c %8s %5T.%9t %5p %2a %3d
%D — The device on which the event was executed, Major and minor versions, the ratio can be viewed through the output of the lsblk utility
[root@centos7 blktrace]# lsblk
NAME MAJ:MIN RM SIZE RO TYPE MOUNTPOINT
sda                     8:0     0 8G    0 disk
├─sda1                  8:1     0 1G    0 part /boot
└─sda2                  8:2     0 7G    0 part
  ├─centos_centos7-root 253:0   0 6,2G  0 lvm /
  └─centos_centos7-swap 253:1   0 820M  0 lvm [SWAP]
sr0 11:0 1 1024M 0 rom
%2c — The number of the CPU core that handled this event.
%8s — sequence number of event
%5T.%9t — Seconds and nanoseconds since the start of the dump.
%5p — PID
%2a — Action with a data block, the main ones are:
С — complet. The request was completed, but this does not mean that it was completed successfully.
Q — queued. Checking the queue.
A — remap. Send the event to the device below. For example from LVM to disk.
G — get request. Sending a request to the device to allocate the container of the data structure.
I — inserted. Add the Linux scheduler to the queue.
D — issued. Passing the block to the device driver.
M — back merge, F — front merge. There are blocks that have a common data boundary and can be combined in one operation.
%3d — RWBS field:
R — read, W — write, D — canceling an operation, B — barrier operation, S — synchronization.
Statistics
After the events, there is a block of statistics on CPU cores, which aggregates information on all actions, how many events were, how many events were merged and executed.
Practical use
Start dump recording on SDA device
[root@centos7 blktrace]# blktrace -d /dev/sda -o sda
In another console, we launch test events for writing data to a block device
[root@centos7 ~]# sync; echo 1 > /proc/sys/vm/drop_caches
[root@centos7 ~]# dd if=/dev/urandom of=/tmp/test bs=4k count=1024 &
[1] 3944
We reset the disk cache and start copying.
[root@centos7 blktrace]# blkparse -i sda.blktrace.0 | awk '$5==3944 {print}' | wc -l
324
There were 324 events in total, we will not consider all of them, we will divide them into 2 stages, reading and writing.
Reading
The question arises, where did we get reading from in this dump, if we read from a pseudo-device, the answer is because before running the command, we flushed the disk cache, then reading from the disks was required to raise the command and dependent libraries.
Let's take reading one block and what we see:
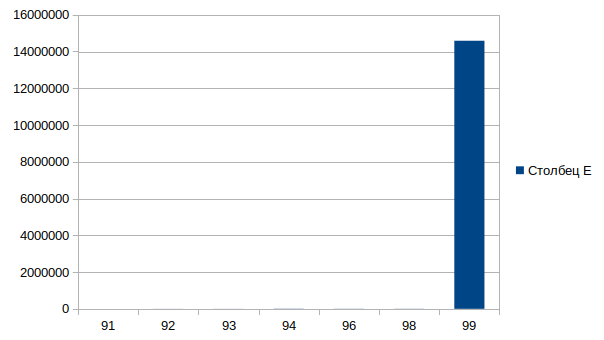
[root@centos7 blktrace]# blkparse -i sda.blktrace.0 | awk '$5==3944 || $5==0  {print}' | grep "13560296\|11461096"
8,2    0       91     4.746796216  3944  A   R 11461096 + 32 <- (253,0) 9779688
8,0    0       92     4.746797670  3944  A   R 13560296 + 32 <- (8,2) 11461096
8,0    0       93     4.746799869  3944  Q   R 13560296 + 32 [bash]
8,0    0       94     4.746809045  3944  G   R 13560296 + 32 [bash]
8,0    0       96     4.746814636  3944  I   R 13560296 + 32 [bash]
8,0    0       98     4.746820116  3944  D   R 13560296 + 32 [bash]
8,0    0       99     4.761404769     0  C   R 13560296 + 32 [0]
91 — the event arrived on device 8.2 and remap was performed on device 8.0. At the same time, the tail of the message (<- (253.0) 9779688) tells us that this event also came to us from device 253.0, but since we took the dump from device 8.0, we do not see it. Also, note that the block itself changes, since each device has its own.
lsblk — will help us define the event trace
[root@centos7 blktrace]# lsblk
NAME                    MAJ:MIN RM  SIZE RO TYPE MOUNTPOINT
sda                       8:0    0    8G  0 disk
├─sda1                    8:1    0    1G  0 part /boot
└─sda2                    8:2    0    7G  0 part
  ├─centos_centos7-root   253:0  0  6,2G  0 lvm  /
  └─centos_centos7-swap   253:1  0  820M  0 lvm  [SWAP]
sr0                       11:0   1 1024M  0 rom
92 — remap event to device 8.0
93 — queued. Checking the io queue.
94 — get request. Checking device readiness.
96 — inserted. Adding a read command to the queue.
98 — issued. Send to device.
99 — complet. Device notification that task completed.
If we disassemble this event, we see that it was completed successfully, in 0.014608553 seconds, which is pretty fast, but if we break it down into stages, we get that the slowest operation is between 98 and 99 events 0.14584653 seconds.
Writing.
Similarly, we will check one block for writing
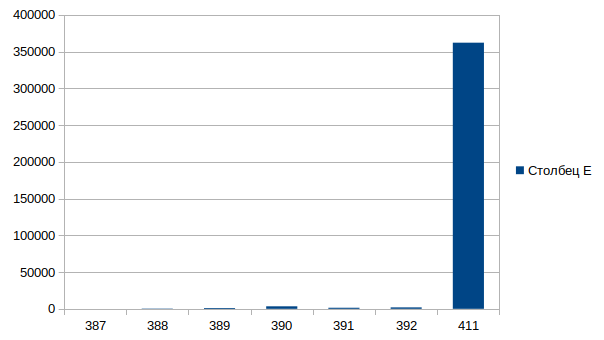
[root@centos7 blktrace]# blkparse -i sda.blktrace.0 | awk '$5==3944 || $5==0  {print}' | grep "5804632\|7903832"
8,2    0      387     4.964830989  3944  A   W 5804632 + 1024 <- (253,0) 4123224
8,0    0      388     4.964831398  3944  A   W 7903832 + 1024 <- (8,2) 5804632
8,0    0      389     4.964832500  3944  Q   W 7903832 + 1024 [bash]
8,0    0      390     4.964835923  3944  G   W 7903832 + 1024 [bash]
8,0    0      391     4.964837361  3944  I   W 7903832 + 1024 [bash]
8,0    0      392     4.964839281  3944  D   W 7903832 + 1024 [bash]
8,0    0      411     4.965201318  3944  C   W 7903832 + 1024 [0]
The list of events is identical as for reading, I will not repeat myself.
The final timeline is as follows
Sum
As we can see (and in principle we know) that a block device is the slowest in a PC, but the ability to use this tool can identify other problems, such as queue overflow, conduct scheduling research, etc.
Bonus.
BTT utility, dump visualization )
[root@centos7 blktrace]# btt -i sda.blktrace.0 -o sda
[root@centos7 blktrace]# cat sda.avg
==================== All Devices ====================
ALL           MIN           AVG           MAX           N
--------- ------------- ------------- ------------- -----------
Q2Q       0.000003499   0.169834820   8.225748599         106
Q2G       0.000000420   0.000001949   0.000009176         104
G2I       0.000000715   0.000059087   0.000447256         104
Q2M       0.000000983   0.000001636   0.000002793           3
I2D       0.000000259   0.001408037   0.018125005         104
M2D       0.000659133   0.000666699   0.000675267           3
D2C       0.000101756   0.020238508   0.042954645         107
Q2C       0.000108231   0.021685131   0.051552538         107
==================== Device Overhead ====================
DEV        |       Q2G       G2I       Q2M       I2D       D2C
---------- | --------- --------- --------- --------- ---------
 (  8,  0) |   0.0087%   0.2648%   0.0002%   6.3111%  93.3290%
---------- | --------- --------- --------- --------- ---------
   Overall |   0.0087%   0.2648%   0.0002%   6.3111%  93.3290%
- Transcript:
Q2Q — time between system queue traces
Q2I — Time required to insert or merge incoming I / O into a request queue.
Q2G — The time it takes to receive the request.
G2I — The time it takes to put this request on the request queue.
Q2M — Time to merge
I2D — The time spent on the request queue.
D2C — Time of request execution, from the moment of transmission to the device.
Q2C — Q2I + I2D + D2C